01
Machine & sensor data
Production counters, machine state and quality signals are exposed through a structured data interface.
A shop-floor production dashboard that turns live packing-line data into clear, immediate information for operators, supervisors and production teams.
Operators needed a simple way to understand packing-line performance without navigating multiple systems or reports.
The objective was to bring production, machine state, quality and shift information together on a display that could remain visible throughout the working day and continue behaving predictably during connectivity issues.
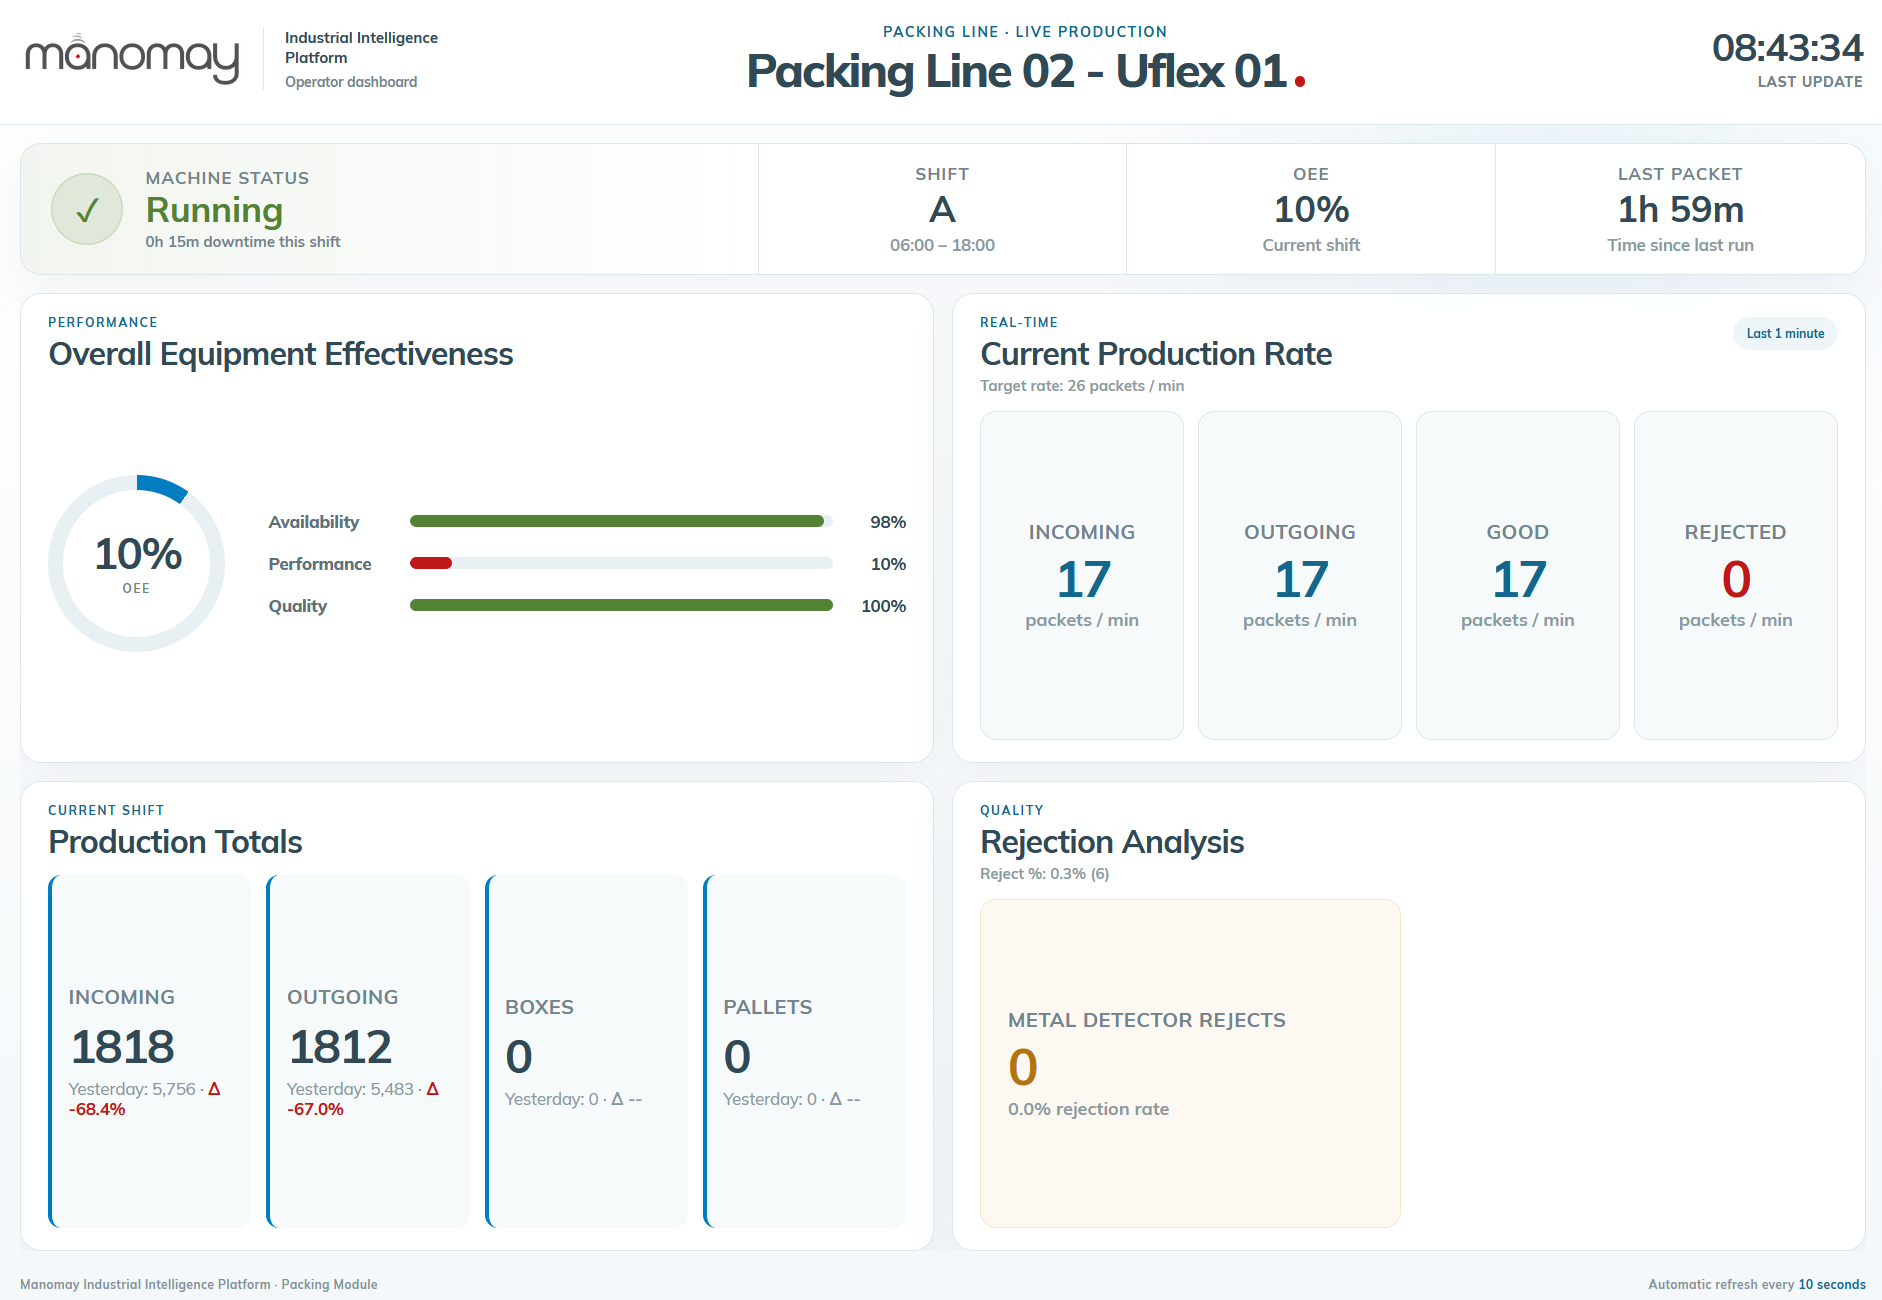
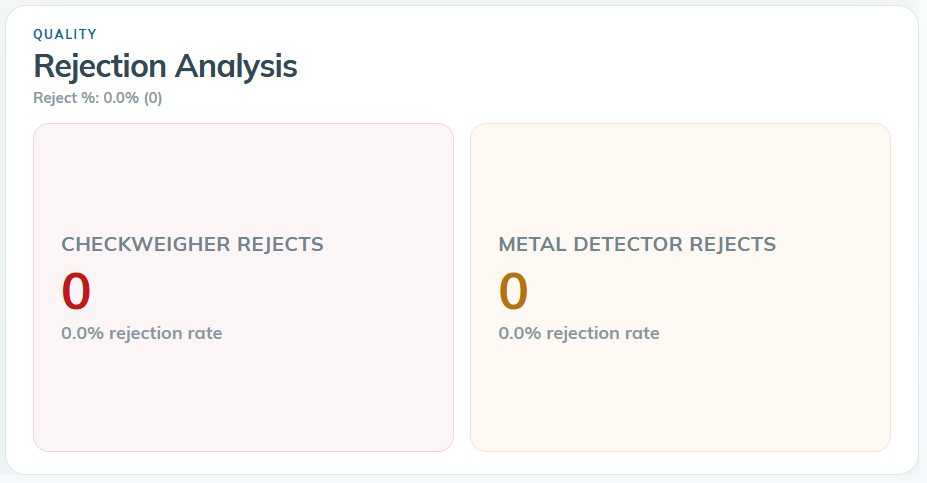
The display prioritises the information operators need most: production pace, shift progress, downtime, quality and emerging exceptions.
A lightweight industrial data flow converts machine signals into meaningful production information and presents it through an always-visible kiosk interface.
Production counters, machine state and quality signals are exposed through a structured data interface.
Raw signals are transformed into shift metrics, production status, OEE and actionable line information.
The dashboard is designed specifically for unattended, always-visible displays on the production floor.
Connectivity checks, retry logic and stale-data handling keep the display understandable when infrastructure is unavailable.
Large hierarchy, high-contrast states and concise KPI framing make the interface easy to understand from the shop floor.
The same production platform extends beyond the shop-floor display with structured reporting across time periods, shifts and historical OEE performance.
Production information can be analysed from the current moment through to long-term historical periods.
Teams can compare equivalent operating periods to identify changes in output, quality and overall line performance.
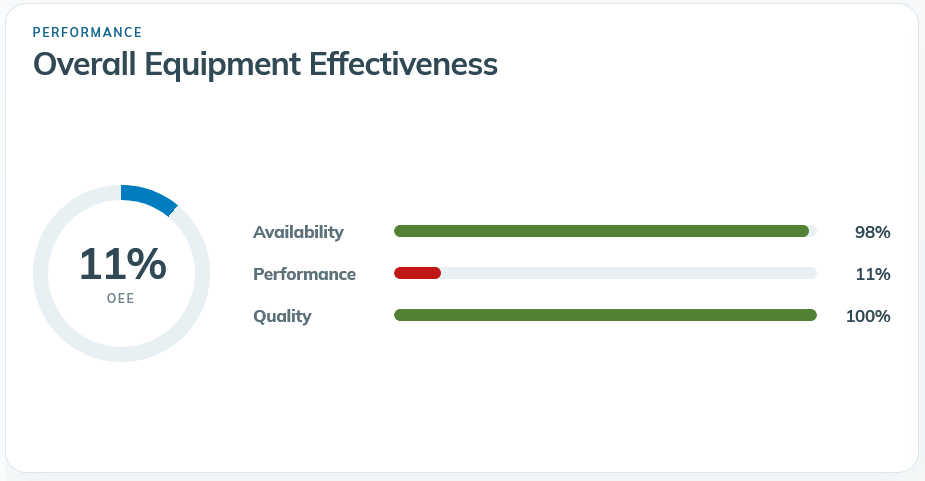
Historical OEE data makes performance development visible over time and helps teams separate one-off events from recurring losses.
The kiosk supports immediate decisions on the production floor, while reporting and comparison views give supervisors and management the historical context needed to understand trends, benchmark shifts and focus improvement efforts.
The project combined industrial data understanding, application engineering and kiosk deployment into one operational solution.
A production display must remain understandable even when the network, API or kiosk device does not behave perfectly. Recovery behaviour was therefore designed as part of the system, not added afterwards.
The kiosk verifies that the application and required resources are reachable before starting the dashboard.
Once running, the dashboard continues refreshing while clearly indicating when data becomes unavailable or stale.
The implementation uses a focused web stack selected for fast deployment, clear maintainability and reliable kiosk behaviour.
We design industrial dashboards that turn live production data into useful operator insight — from telemetry mapping and application engineering to kiosk deployment and resilience.
Talk to our team